Aggregate list screen (WEB)
When you publish the inspection report, the data is summarized and can be confirmed in the aggregate list. The unit of calculation is summarized as “Same style number + Same inspection type”.
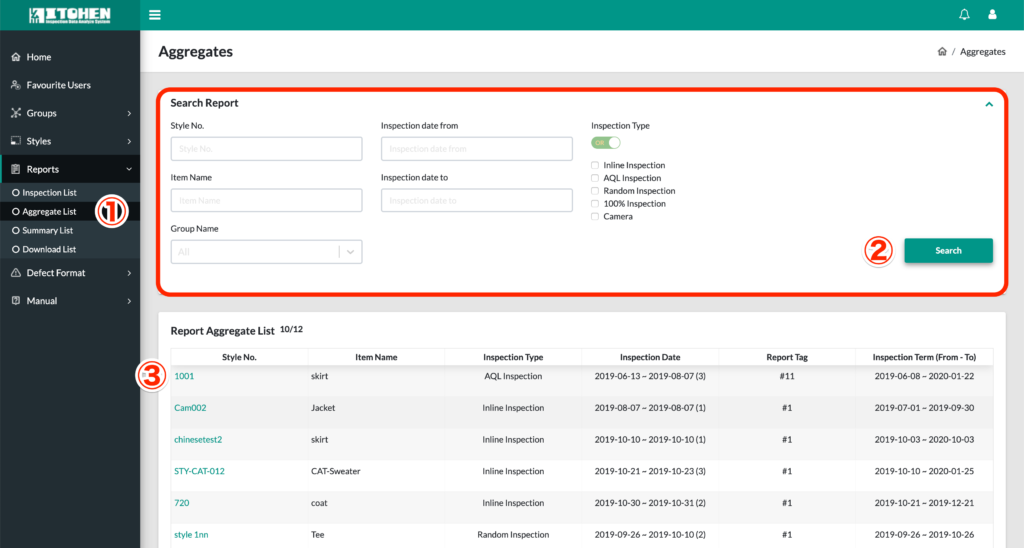
・Open “Reports” on the left menu and click “Aggregate List” in ①
・Enter the style number, group, inspection date, inspection type, etc., and click the “Search” button ② to narrow down the aggregate data you want to check.
・Click the style number displayed in ③ of the aggregate list to open the aggregate details screen.To open the aggregate details, it is recommended that you hold down the “Ctrl” key and click on the style number to open it in a new tab.
Check the aggregate detail (WEB)

・Set the search criteria such as inspection date, report tag number, First inspection / Re-inspection, Major / Minor defect, etc., and click ① “Search” button to display the narrowed results.
・② displays the total number of inspections. The result changes depending on the narrowing down in ①.
・③ displays the total number of A grade. The result changes depending on the narrowing down in ①.
・④ displays total defect rate. The result changes depending on the narrowing down in ①.
・⑤ displays the number of inspection days. The result changes depending on the narrowing down in ①.
・⑥ is a heat map displayed only for inline inspection. The heat map is a diagram to help you understand where and what kind of defects occurred.
It is possible to narrow down on the sewing line or display from the list of defective contents.
The button “Absolute” is a function that displays places where there are many defective parts on each side, and “Relative” is a function that compares all four sides and displays places where there are many defective parts in red.
Check the inspection status graph and defect status graph (WEB)

・⑦ is a graph that summarizes the number of defect points, the number of products, the number of inspections, etc. for each day. It is possible to switch to daily, weekly, and monthly data by using the upper right button.
・⑧ is a slider to change the display range. See the video below.
・⑨ is a stacked graph of defective items. By clicking on the label, it is possible to show or hide the defective items and switch them. See the video below.
Check the pareto chart (WEB)
“Pareto chart” is a chart that sorts data by items and arranges them in descending order, so that important items can be extracted.

For example, it is possible to easily compare the results of the previous week’s defect improvement with the data of this week.
First, specify the range for the previous week to the “Date from” and “Date To” in ⑩. Next, specify the range for this week for “Date from” and “Date To” in ⑪. After that, click the “Search” button to display the previous week’s graph and this week’s graph for comparison.
The top 5 defective items are displayed by the bar graph, and the percentage is displayed by the line graph is displayed. The height of the left and right graphs is displayed differently, but this is for the purpose of making it possible to judge instantly by aligning the number of defects in the left and right graphs. If the height of the graph on the right is lower than the height of the graph on the left, it indicates that the improvement is in progress.
Download inspection report (WEB)
Inspection reports can be downloaded from the aggregate details “Download By Date”.

・If you click the download icon displayed on the calendar in ⑫, you can download the inspection report on a daily basis.
・It is possible to download the inspection report that summarizes the data of the range by setting the inspection start date and end date range in ⑬ and click the download button. Use the batch download function for inspection reports when you want to download the inspection data for each day within the setting range at once.